A Chromatin Landmark and Transcription Initiation at
Most Promoters in Human Cells
Data
Figures
Supplemental Information
Acknowledgements
References
|
Supplemental Figure S6
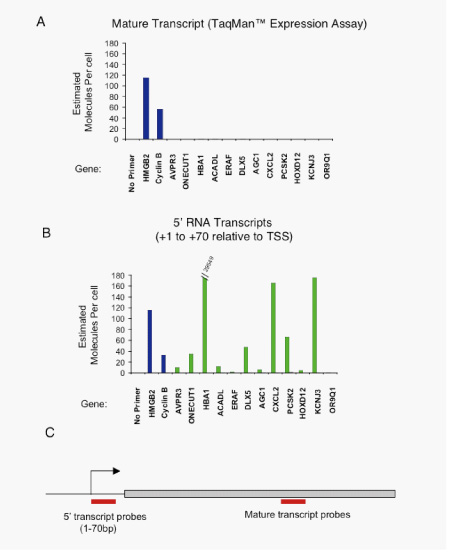
Figure S6. RT-PCR based detection of 5 RNA transcripts at inactive genes
A. RT-PCR based detection of full length mRNAs from total RNA extracted from hES cells using TaqMan probes (Applied Biosystems). Estimated transcripts per cell were obtained by dividing the number of molecules of cDNA, as determined by relative quantitation using the standard curve in (S5) by the number of cells used for the amplification. Positive control probes (active genes as determined by MPSS and Affymetrix data, blue bars) and test sample probes (Inactive genes as determined by MPSS and Affymetrix data, green bars) are as follows: (1) No probe (2)HMGB2, (4)CCNB1, (5)AVPR3, (6)ONECUT1, (7)HBA1, (8)ACADL, (9)ERAF, (10)DLX5, (11)AGC1, (12)CXCL2, (13)PSK2, (14)HOXD12, (15)KCNJ3, (16)OR9Q1.
B. RT-PCR based detection of 5 RNAs from total RNA extracted from hES cells using SYBR green detection (Applied Biosystems). Estimated transcripts per cell were obtained by dividing the number of molecules of cDNA, as determined by relative quantitation using the standard curve in (S5) by the number of cells used for the amplification. Positive control probes (active genes as determined by MPSS and Affymetrix data, blue bars), control no template (no reverse transcription samples, grey bars which are near zero) and test sample probes (Inactive genes as determined by MPSS and Affymetrix data, green bars) are as follows: (1) No probe (2)HMGB2, (3)CCNB1, (4)AVPR3, (5)ONECUT1, (6)HBA1, (7)ACADL, (8)ERAF, (9)DLX5, (10)AGC1, (11)CXCL2, (12)PSK2, (13)HOXD12, (14)KCNJ3, (15)OR9Q1.
C. Schematic diagram of probe placement for an average gene. 5 RNA was detected within 1-70bp of transcription start site and full length transcript detection was further downstream.
|