A Chromatin Landmark and Transcription Initiation at
Most Promoters in Human Cells
Data
Figures
Supplemental Information
Acknowledgements
References
|
Supplemental Figure S4

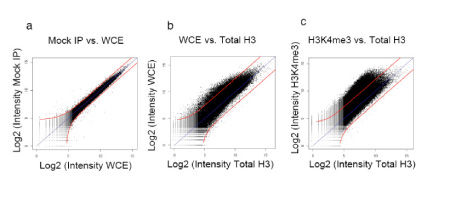
Figure S4. Scatter plots of selected ChIP/chip experiments.
ChIP/chip experiments from human H9 ES cells.
A) Log2 intensity for Nonspecific
IgG enriched DNA compared to Log2 intensity of genomic DNA. 1:1 ratio
is indicated by the blue line. Single probe p-value of 10-3 is indicated by the red
lines.
B) Log2 intensity for genomic DNA compared to Log2 intensity of anti-H3
globular enriched DNA.
C) Log2 intensity for anti-H3K4me3 enriched DNA
compared to Log2 intensity of anti-H3 globular enriched DNA.
|