 |
|
Activated Signal Transduction Kinases Frequently Occupy Target Genes
Acknowledgements |

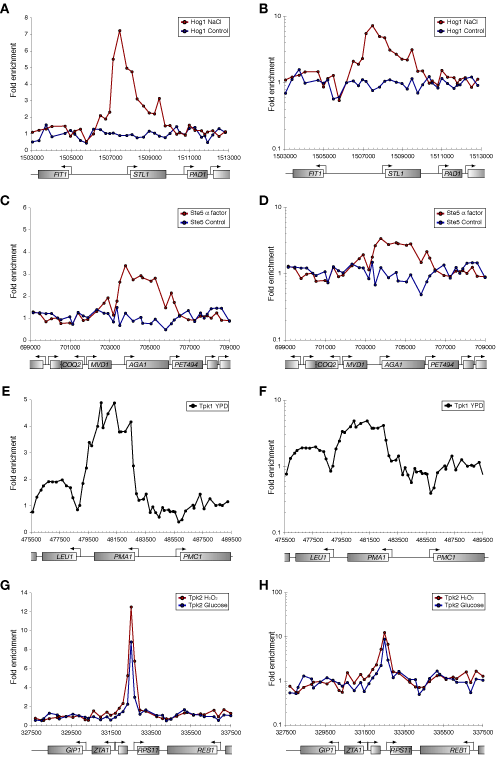
Representation of ChIP-chip data using linear and logarithmic scales for ChIP enrichment ratios. The panels on the left show data plotted on a linear scale, whereas panels to the right show the same data plotted on a log scale. The logarithmic scale is widely used for the representation of expression data to display both positive and neagtive changes in gene regulation. Logarithmic transformation of data is also more appropriate for the multiplicative noise that is typical for microarray data. ChIP-chip experiments, however, are often displayed on a linear scale. Binding events are detected as ratios above 1 after appropriate normalization between the two channels; values below 1 are assumed to be noise and are compressed on a linear scale. Therefore, the linear scale better emphasizes signal versus noise in the display of ChIP-chip data. |
| YOUNG
LAB
Whitehead Institute 9 Cambridge Center Cambridge, MA 02142 [T] 617.258.5218 [F] 617.258.0376 CONTACT US |