Mapping Genome Occupancy in Embryonic Stem Cells Data Global Transcriptional Repression by PRC2Acknowledgements References |
To automatically determine bound regions in the datasets, we developed an algorithm to incorporate information from neighboring probes. For each 60-mer, we calculated the average X score of the 60-mer and its two immediate neighbors. If a feature was flagged as abnormal during scanning, we assumed it gave a neutral contribution to the average X score. Similarly, if an adjacent feature was beyond a reasonable distance from the probe (1000 bp), we assumed it gave a neutral contribution to the average X score. The distance threshold of 1000 bp was determined based on the maximum size of labeled DNA fragments put into the hybridization. Since the maximum fragment size was approximately 550 bp, we reasoned that probes separated by 1000 or more bp would not be able to contribute reliable information about a binding event halfway between them. This set of averaged values gave us a new distribution that was subsequently used to calculate p-values of average X (probe set p-values). If the probe set p-value was less than 0.001, the three probes were marked as potentially bound. As most probes were spaced within the resolution limit of chromatin immunoprecipitation, we next required that multiple probes in the probe set provide evidence of a binding event. Candidate bound probe sets were required to pass one of two additional filters: two of the three probes in a probe set must each have single probe p-values < 0.005 or the center probe in the probe set has a single probe p-value < 0.001 and one of the flanking probes has a single point p-value < 0.1. These two filters cover situations where a binding event occurs midway between two probes and each weakly detects the event or where a binding event occurs very close to one probe and is very weakly detected by a neighboring probe. For RNA polymerase II, his algorithm identified 22,912 bound probe sets of RNA polymerase II ChIP-enriched DNA across the genome. Individual probe sets that passed these criteria and were spaced closely together were collapsed into bound regions if the center probes of the probe sets were within 1000 bp of each other. This final step reduced the 22,912 peaks to 10,244 bound regions. The bound regions had a median size of 950 bp. The ES cell line we used (H9) has a female karyotype (XX). Nineteen (0.18%) of the RNA polymerase II bound regions mapped to the Y chromosome and 6 of these correspond to the promoters of known genes. Each of these 6 genes (ASMTL, CXYorf2, HIT000024005, PLCXD1, PPP2R3B and SYBL1) are also present on the X chromosome suggesting that all of these bound regions are duplicate measurements of X chromosome binding events caused by hybridization of X chromosome DNA to Y chromosome probes. Subtracting out these duplicates leaves 10,225 unique genomic regions bound by RNA polymerase II in ES cells. Peak finding for genome-wide Suz12 binding data was carried out as described above for RNA polymerase II with the following modifications. Probe sets were marked as potentially bound if the p-value of average X (probe set p-values) was less than 0.0001 and probe sets were required to pass one of two additional filters: two of the three probes in a probe set must each have single probe p-values < 0.0005 or the center probe in the probe set has a single probe p-value < 0.0001 and one of the flanking probes has a single point p-value < 0.01. This algorithm identified 16,438 bound probe sets of Suz12 ChIP-enriched DNA across the genome. As before, individual probe sets that passed these criteria and were spaced closely together were collapsed into bound regions if the center probes of the probe sets were within 1,000 bp of each other. This final step reduced the 16,348 peaks to 3,446 bound regions. The bound regions had a median size of 1,248 bp. Unlike RNA polymerase II, Suz12 was often associated with large regions of DNA stretching over multiple kilobases of contiguous sequence. 28% of Suz12-bound regions were over 2 kb in size, compared with only 7% of RNA polymerase II-bound regions. In some instances, multiple large regions were clustered in close proximity as shown for the Hox clusters.
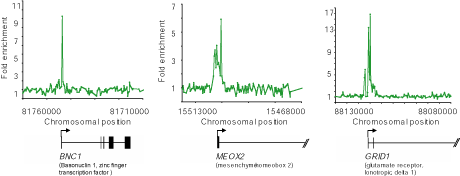
Figure 1c. Genome-wide ChIP-Chip in human embryonic stem cells. Examples of Suz12 ChIP signals from genome-wide ChIP-Chip. The plots show unprocessed enrichment ratios (blue) for all probes within a genomic region (ChIP vs. whole genomic DNA). Chromosomal positions are from NCBI build 35 of the human genome. Genes are shown to scale below plots (exons and introns are represented by vertical lines). The start and direction of transcription are noted by arrows. |
| YOUNG
LAB
Whitehead Institute 9 Cambridge Center Cambridge, MA 02142 [T] 617.258.5218 [F] 617.258.0376 CONTACT US |