Data and Downloads
Acknowledgments |
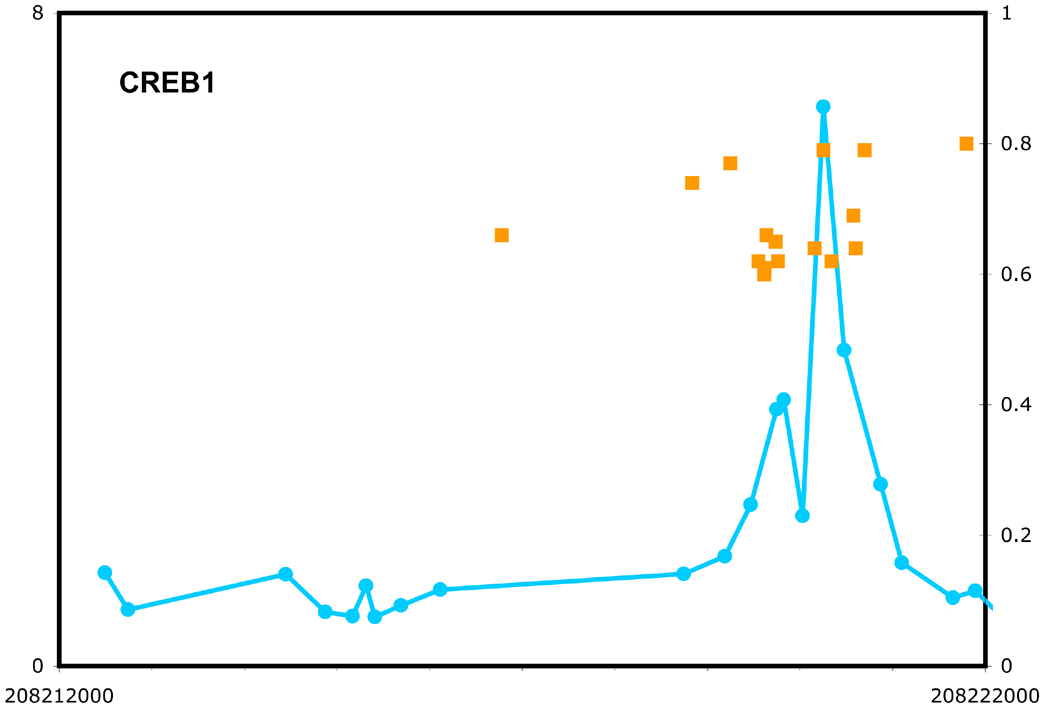
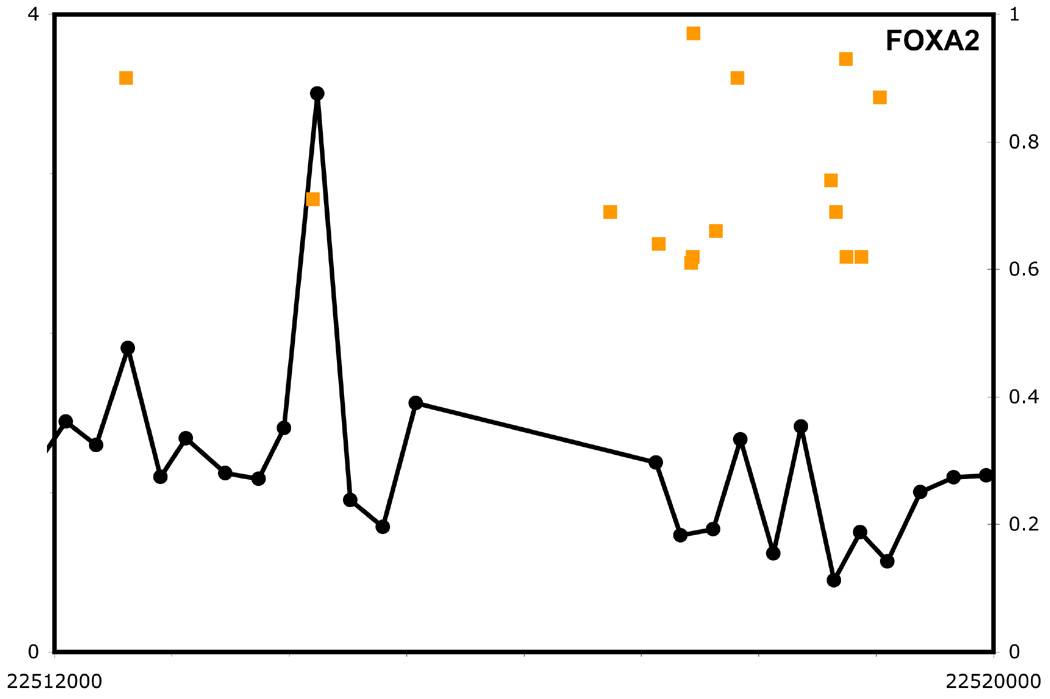
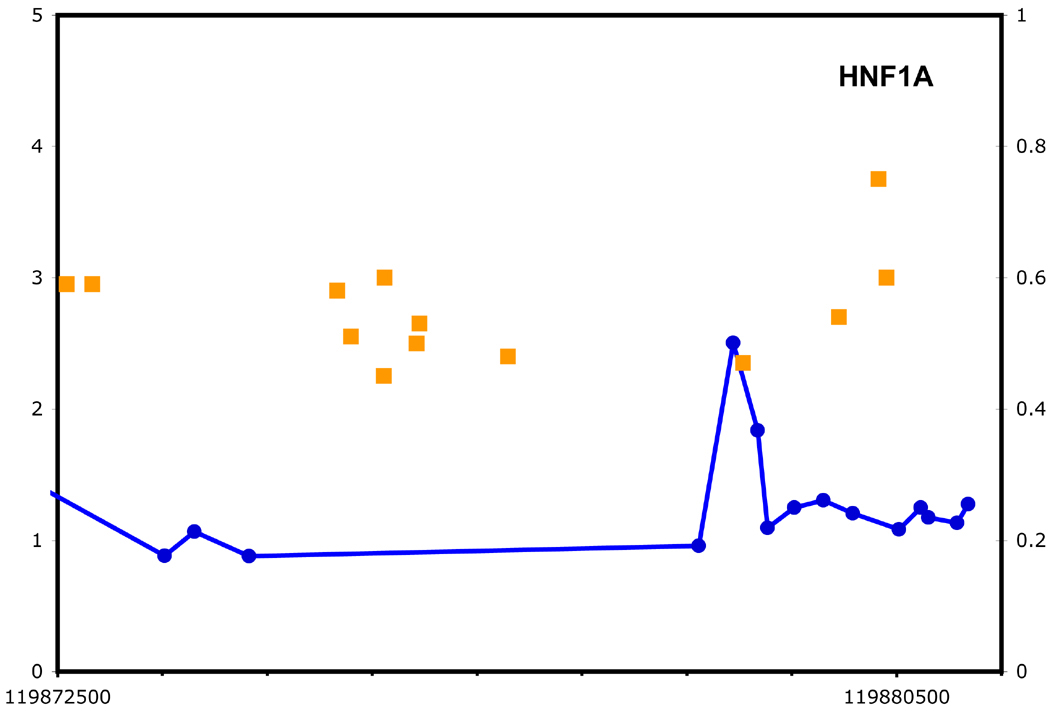
Below are the promoter regions for the five regulators we found to have autoregulatory loops. Genomic position is plotted as the X- axis. The y-axis maps, as primary, the enrichment ratio (left axis). The secondary, right axis linearly plots the quality score of the binding site determined within the promoter region. In each case there is a good binding site at, or extremely close to, the autoregulatory binding peak.
|


| YOUNG
LAB
Whitehead Institute 9 Cambridge Center Cambridge, MA 02142 [T] 617.258.5218 [F] 617.258.0376 CONTACT US |