Transcriptional Regulatory Code

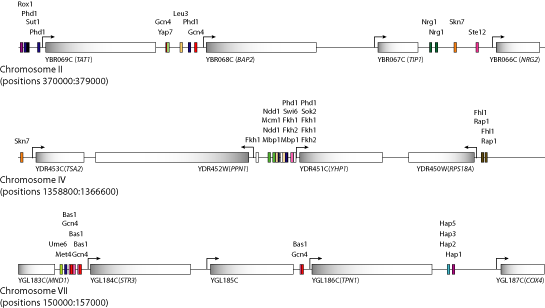
Portions of the genomic map of regulatory code sequences. Regions of Chromosomes II, IV and VII are shown including the locations of conserved DNA sequences bound in vivo by transcriptional regulators. Genes are shown as grey rectangles with arrows indicating direction of transcription; binding sequences are shown as colored boxes.

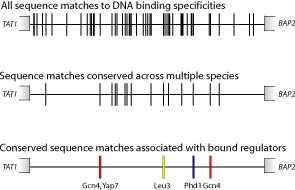
The 884 basepair intergenic region upstream of the gene BAP2 is presented as a single horizontal line. Open reading frames are indicated by the flanking shaded boxes. Three different sets of sites are depicted: All sequences matching a DNA specificity from our compendium (top line, vertical black lines); all such sequences that are conserved in multiple species (middle line, vertical black lines); all such sequences that are conserved in regions that are bound by a regulator as indicated by location analysis (bottom line, vertical colored lines). Cognate regulators are labeled on the bottom line.

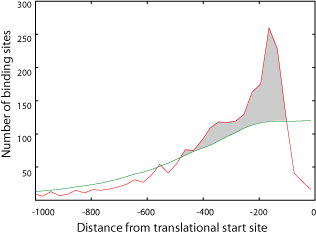
Distribution of regulator binding sites. The red line shows the distribution of distances from the start codon (ATG) of each gene to binding sites in the adjacent upstream region. The green line shows the same distribution calculated on ten thousand "randomized" genomes in which the binding sites in each intergenic region were redistributed randomly and independently between the adjacent genes. The region from -100 to -500 (grey) contains many more binding sites than expected.