Proteome Genome Interactions

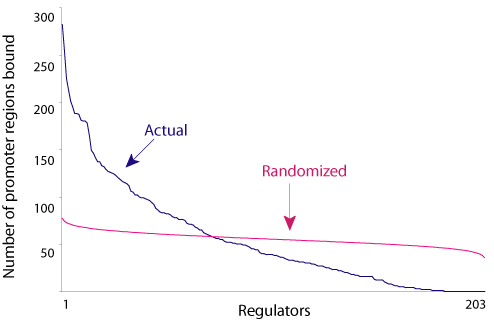
Distribution of the number of promoter regions bound per regulator (blue). For regulators profiled under multiple conditions, the union of promoter regions bound under all conditions is reported. An average of randomized distributions for the same set of P values randomly assigned among regulators and promoter regions is shown in pink.

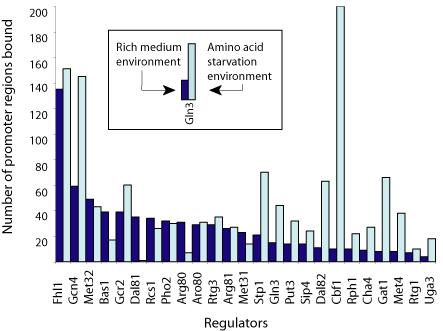
Pairwise comparison of the number of promoter regions bound under two different conditions for 25 regulators. Dark blue bars represent the number of promoter regions bound under growth in rich medium; light blue bars represent the number of promoter regions bound under growth in amino acid starvation medium. An Excel sheet containing the corresponding values can be found here.