|
Time course data (in hours): |
|
|
|
|
|
|
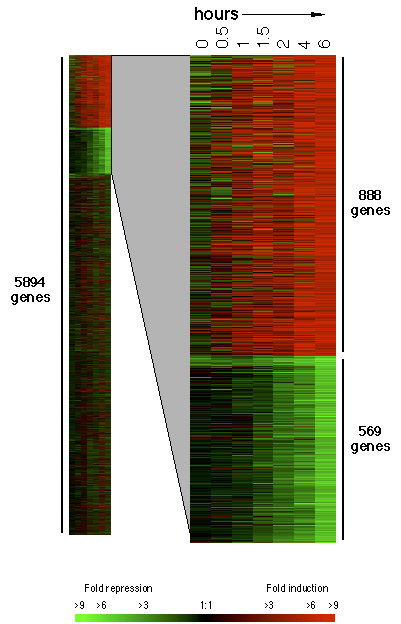 |
Histone Time Course
We have used a glucose shut down system to stop Histone H4 transcription. Cells harboring a deletion of both Histone H4 genes (HHF1, HHF2) and a plasmid with the GAL promoter driving expression of Histone H4 (HHF2), were grown in YEP with 2% galactose. The cells were transfered to YEP with 2% glucose and grown for 0, 0.5, 1, 1.5, 2, 4, or 6 hrs. The OD600 at the time of transfer to glucose was selected to control for effects of cellular density.
|
Time course data (in hours): |
|
|
|
|
|
|
|
|
The left part of the above figure depicts the transcription level of all of the genes for which data could be collected over the histone depletion time course. The right part of the figure is an enlargement of the indicated region from the left part of the figure. Red coloring indicates that the transcription level of the gene increases when histones are depleted for a given period of time, whereas green coloring indicates that the transcriptional level has decreased. The genes whose expression increases are grouped together and genes whose expression decreases are grouped together. This figure was produced using the TreeView program (19).