(1)
![]()
Location Analysis: Single Array Error Model
The quantitative amplification of small amounts of DNA generates some uncertainty in values for the low intensity spots. In order to track that uncertainty and average repeated experiments with appropriate related weights, we adopted a single-array error model first described by Hughes et al. (2000).
According to this error model, the significance of a measured ratio at a spot is defined by a statistic X, which takes the form
|
(1) |
|
|
(2) |
p = 1-Erf(X) |
For each factor, three independent experiments were performed and each of the three samples were analyzed individually using the single-array error model described above. The average binding ratio and associated p-value from the triplicate experiments were then calculated using a weighted average analysis method adapted from Hughes et al. (2000).
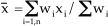
Briefly, the binding ratio is expressed as the log10(a2/a1), where a1,a2 are the intensities measured in the two channels for each spot. The uncertainty in the log(Ratio) is defined as
| (3) |
|
| (4) |
|
| (5) |
|
Here ![]() i
is the error of log10(a2/a1) from (3), xi
stands for i-th measurement of log10(a2/a1),
n is the number of repeats.
i
is the error of log10(a2/a1) from (3), xi
stands for i-th measurement of log10(a2/a1),
n is the number of repeats.
The error of  can be computed in two ways. One is to propagate the errors
![]() i
, another is from the scatter of xi:
i
, another is from the scatter of xi:
| (6) |
|
For the average of multiple slides, the significance statistic X is computed as:
| (7) |
|
and the confidence is computed using Equation (2) from the single array error model.